
Market Research: An Overview and Step-by-Step Guide
Market Research: An Overview and Step-by-Step Guide
To compete in today’s highly competitive markets, it’s essential to keep your finger on the pulse when it comes to market conditions, consumer behavior, and emerging trends. This can be a difficult task. Market conditions change rapidly, consumer habits shift, and trends begin and end in the blink of an eye.
Conducting good market research is the only way to remain competitive. In this article, we’ll explore what market research is, why it’s important, and how you can get started with your own exploratory research.
What Is the Role of Market Research?
Market research is the process of gathering information about a target audience. During the process, you’ll discover who your customers are and what they want. It allows you to answer questions like:
Market Research: An Overview and Step-by-Step Guide
- What are the demographics of my target audience?
- What are their interests and buying habits?
- What do they think about my business or industry?
- What problems can I help this group of people solve?
- How can I best connect with them?
Understanding your target audience lets you identify opportunities, persuade stakeholders, and attract a loyal customer base. All of these things contribute to a healthy business plan and robust marketing strategy.
While market research involves analyzing analytics data, it’s more than simply tracking numbers like traffic volume or what items customers purchase. Market research goes one step further by attempting to uncover the “why” behind the numbers. We want to understand why customers connect on an emotional level.
When Should You Conduct Market Research?
Market Research: An Overview and Step-by-Step Guide
The short answer to this question is always. Because markets and customers are always changing, it’s important to stay informed.
In reality, market research is time consuming and resource intensive. You’ll want to be strategic about when you conduct your research studies.
Here are 4 times when you should definitely complete market research:
- Before launching a new business or venture—Initial market research is important before making investments in new businesses or ventures. It’ll help you uncover competing products, pricing structures, and marketing efforts.
- Before entering new markets—It’s crucial to understand your potential customers in new markets. Economic shifts, emerging trends, and cultural values differ from place to place. Market research can help you avoid costly mistakes.
- Before developing or launching new products or services—As your company grows, you’ll likely roll out new products and/or services. You’ll want to understand the market conditions before making any big moves.
- After any of the above—After launching a new business, entering new markets, or releasing new products or services, make plans to conduct a follow-up round of research. This will help you determine what’s working and what needs work.
AI Powered Market Research
with Kompyte by seotool
Market Research: An Overview and Step-by-Step Guide
What Are the Different Types of Market Research?
Market Research: An Overview and Step-by-Step Guide
When you’re ready to begin research, start considering what insights you’re looking for. Are you trying to understand your competitors? Do you want to better market your products? Looking to address a customer pain point?
To get the answers you’re looking for, there are two main types of market research:
Primary Market Research
Market Research: An Overview and Step-by-Step Guide
Primary market research is completed “in house” through your own efforts. Conducting primary research allows you to tailor your research to your specific products and services. It gives you the highest level of control over research quality.
Primary research methods include:
- Focus groups
- Interviews
- Observation based research (in-person observation, videos, case studies)
- Buyer persona research
- Market segmentation research
From these research methods, you can collect two different types of data:
- Qualitative—Data that isn’t counted or measured, including people’s preferences, dislikes, and emotional responses. Interviews and discussion groups typically produce qualitative data. You likely wouldn’t use an algorithm or equation to draw conclusions from this kind of data.
- Quantitative—Data generated from numbers. It includes things like page views, survey results, and social media follows. With this kind of data, you can produce charts and graphs.
Secondary Market Research
Market Research: An Overview and Step-by-Step Guide
Secondary market research is research conducted by someone else. Because the data is already available, it’s typically more cost effective, and less time and resource consuming to collect.
Here are some secondary sources:
- Company reports—Reports created by companies about their own business.
- Company websites
- Investor relations websites
- Yahoo and Google Finance
- Industry statistics—Information and data on entire industries, as opposed to single companies.
- White papers—Authoritative market analysis written by 3rd parties about a specific topic related to a given industry.
- Trade magazines
- Market research companies
- Government agency data—Information and data collected by the government and shared with the general public.
With secondary sources that know how to do proper market research, you’ll usually receive a macro level view of your industry and insights about other competitors in the market. Just be sure the data and insights are valid, accurate, and reliable.
A Closer Look at 7 Popular Market Research Methods
Market Research: An Overview and Step-by-Step Guide
Now that we’ve covered the different kinds of market research, let’s look closer at some of the research methods used to gather data.
Different methods produce different kinds of data. So before you begin, think about what type of information you’re seeking.
Interviews
Interviews allow for in-depth discussions with people from your target audience. They can be free flowing and unstructured, or structured and detailed. While interviews are often recorded, recording can influence peoples’ answers.
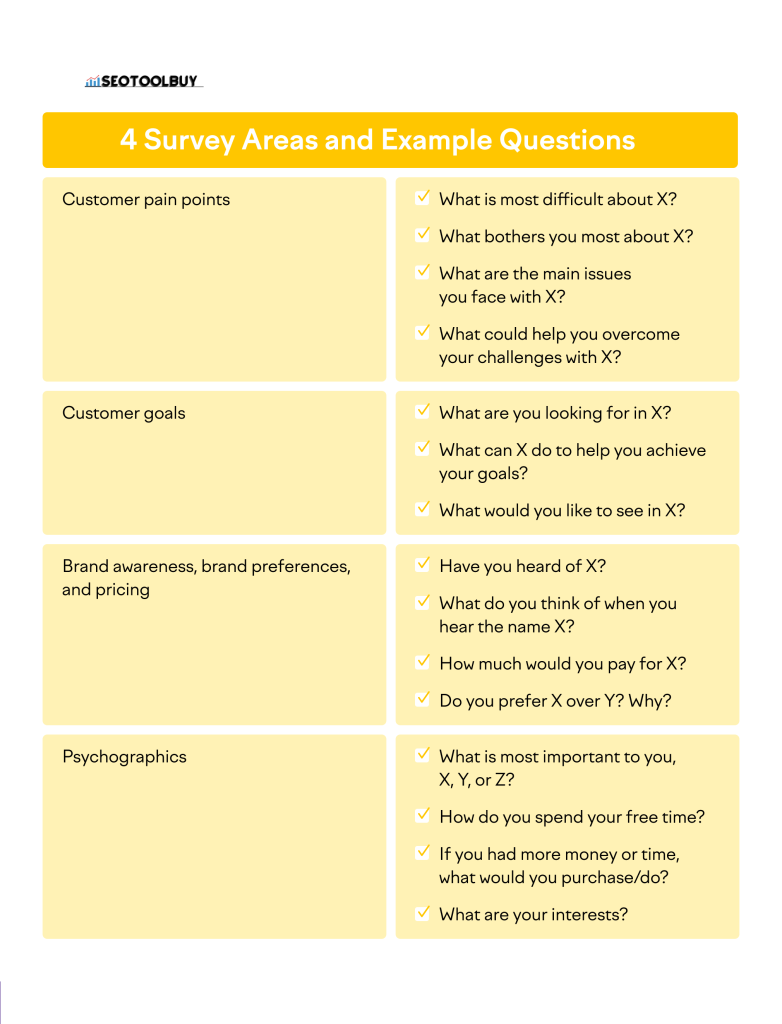
Before interviews, develop a list of questions. What kind of information do you need? Here are 4 areas to consider:
- Customer pain points
- Customer goals
- Brand awareness, brand preferences, and pricing
- Psychographics
Focus Groups
Focus groups consist of 5 to 10 people representing your target audience. These individuals share their thoughts about aspects of your business. Sessions are typically recorded. Listen for trends in responses, and pay attention to tone of voice, facial expressions, and body language.
When reviewing data, look for:
- Repeated words of phrases
- Similar reactions (confusion, frustration, delight)
- Inconsistent reactions or outlying opinions
- Quotes that capture the essence of the group’s feelings, reactions, and opinions
Collect the data in a spreadsheet so you can organize and categorize it later for deeper analysis.
Secondary Market Research Data
Market Research: An Overview and Step-by-Step Guide
Market reports, white papers, and consumer rating sites can provide useful data for your business. Organizations like Pew, Gartner, Ipsos, and Forrester provide expert analysis.
For reviews and ratings, sites like G2 and Trustpilot provide useful insights into customer experience and satisfaction with your company and your competitors. Keep user motivation in mind. Customers often write reviews when they are extremely dissatisfied with a product, so this data may skew in that direction.
Keep user motivation in mind. Customers often write reviews when they are extremely dissatisfied with a product, so this data may skew in that direction.
Observation-Based Research
Observation-based research involves watching people from your target audience interact with products. The way they react, ask questions, hit roadblocks, and respond in other ways provides useful information about how to improve.
For example, you might invite participants to your office to observe them navigate through your website, purchase a product through your online store, or engage with a physical product. You may notice they get lost, enjoy something particular, or get frustrated at a certain point. This data provides insights for improvements.
Market Segmentation & Demographics
Market segmentation is the process of breaking your market’s audience into groups. There are many ways to segment your audience, but a few examples are:
- Demographic information, such as age, gender, or location.
- Socioeconomic factors like household income and employment status
- Psychographic aspects such as interests, desires, and preferences
Thinking about your audience in categories allows you to better understand how to meet their needs and make sure your marketing efforts are impactful.
Semrush’s .Trends tools can unveil demographic, socioeconomic, and psychographic data for any market audience. Let’s use Nike as an example to see what we can learn about their audience.
First, we’ll look at the Demographics report in Market Explorer. This report reflects data from the top sites in Nike’s market.
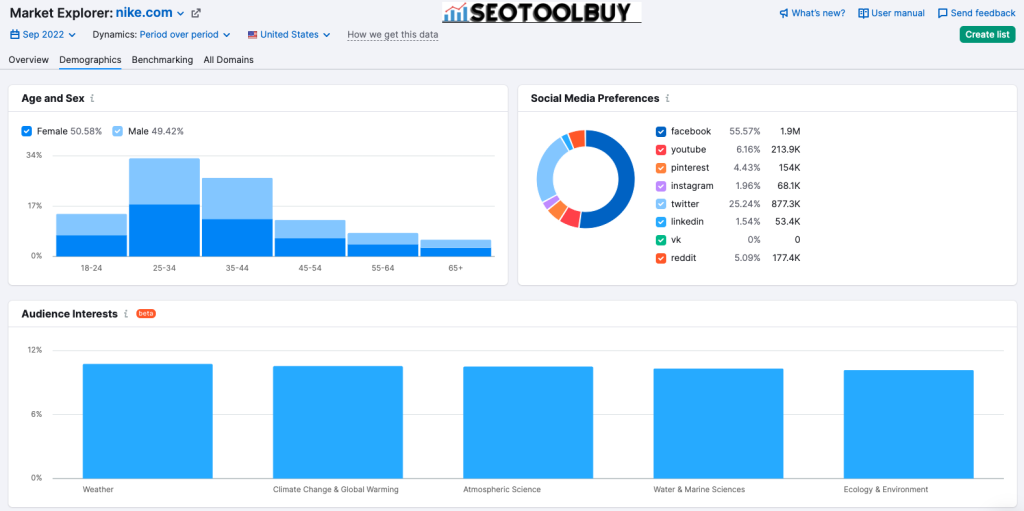
With this report, we discover some important information about Nike’s market.
- The audience is relatively evenly split between men and women, with the 25-34 years of age category being the largest segment.
- Half of the audience prefers Facebook as a social media platform, but Twitter is also popular.
- Nike’s audience is also interested in Climate Change & Global Warming.
With this information, we can make educated guesses about what products our audience might be looking for, and market those products on platforms where this demographic spends the most time.
Turning to the Traffic Analytics tool, we can then gather additional data about a specific competitor’s audience. For example, here’s the Audience Insights report for nike.com.
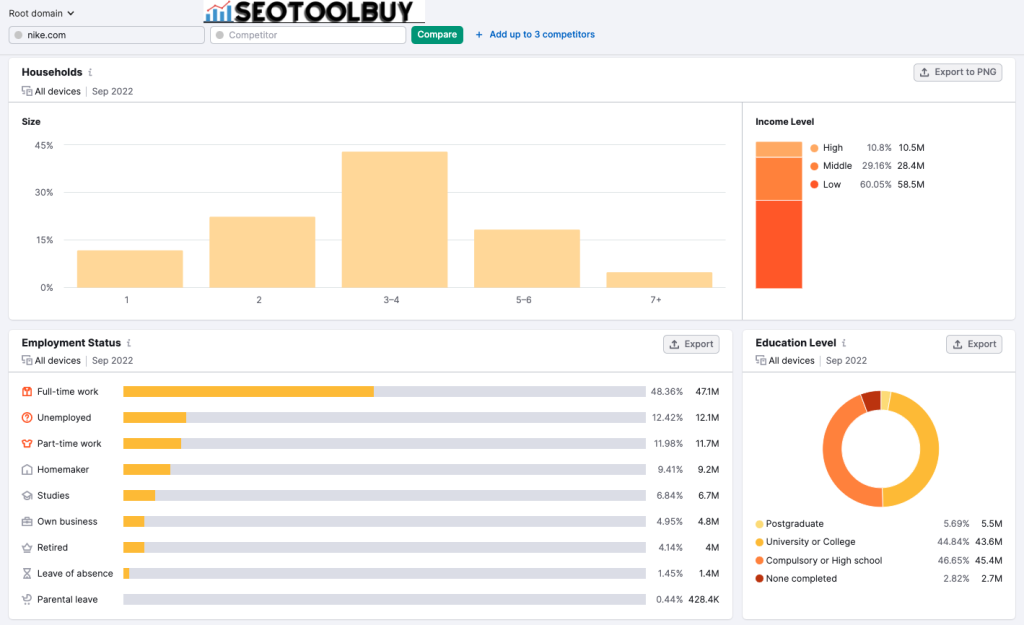
Here are some additional insights about Nike’s audience:
- The majority of Nike’s audience live in households with 3-4 residents, which indicates Nike is popular among families.
- Most of Nike’s customers fall into the middle or low income level.
- The majority of Nike’s audience works full time, but it’s interesting to notice that a large segment of the audience are homemakers.
- Over 90% of the audience has graduated from highschool or gone to college
Like the Demographics report, this additional information can help you connect with your audience by offering messages they relate to, in a language they understand, about products they want and can afford.
Competitive Analysis
Competitive analysis is the process of taking a deep dive into your competitors’ products, services, prices, promotions, and other activities. By analyzing competitors, you can avoid their mistakes, replicate their success, and stay on the cutting edge of your industry.
Surveys
Surveys allow you to easily connect with your audience and receive direct feedback. Conducted online, you can reach a large number of participants and let them respond quickly.
Sites like Survey Monkey and Google Forms provide survey templates, distribution tools, and data organization and display options. Social media platforms also allow you to survey your audience.
Surveys allow you to collect both quantitative and qualitative data. Provide a variety of question types—multiple choice, “yes or no”, short answer, and scales—to keep your audience engaged and provide a wide variety of useful data points.
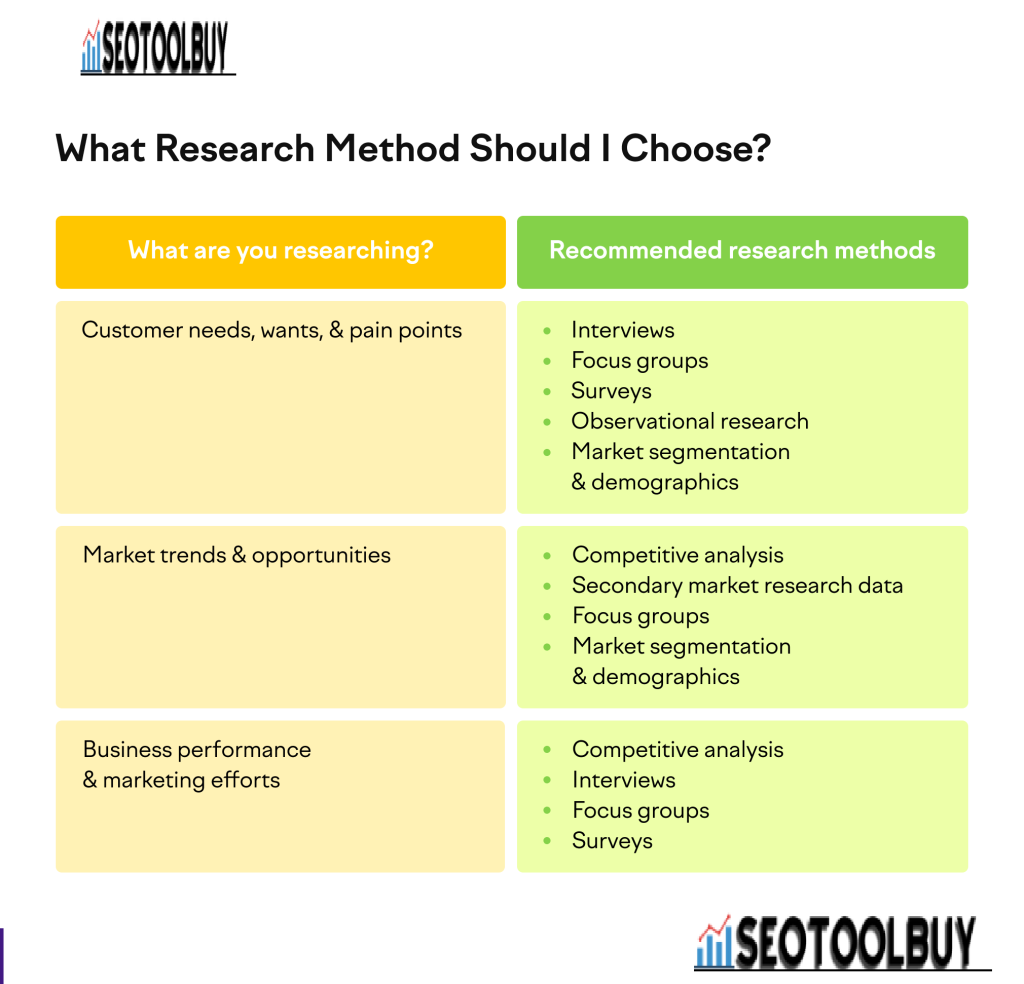
Choosing the Right Research Method
The research method you choose will depend on what you’re trying to understand about your market.
Do you want to know what your customers want or need? Are you trying to track industry trends? Are you trying to figure out how to improve your marketing?
View this chart for some ideas for what methods to use.
A Step-by-Step Market Research Guide (with Example Tools)
We’ve defined market research, outlined the different types, and offered the most popular methods for gathering data. But you still may be asking, “What does market research consist of?” Let’s examine how to start market research for your own company.
Here, we’ll offer you a simple market research template:
- Define the research problem
- Develop a research plan
- Collect data
- Analyze data and generate insights
- Present findings and adjust your plan
To explore this process, we’ll imagine we own a footwear company seeking to break into the running shoes market.
Step 1: Define the Focus of Your Research
Before you begin collecting data, you need to know the focus of your research. This allows you to choose the right methods and tools.
Do you have a question about your business? Do you see an opportunity in the market you want to explore further? Have you noticed something curious about your product?
Based on your initial observations or questions, you can begin exploring what people search for on the internet to determine their intent, pain points, and preferences. This can help narrow your focus and move you toward next steps in developing a research plan.
As the owners of a footwear company launching a new shoe line, we could begin with Semrush’s Keyword Magic tool. First, choose the target country, then type in the keyword. For example, “running shoes.”
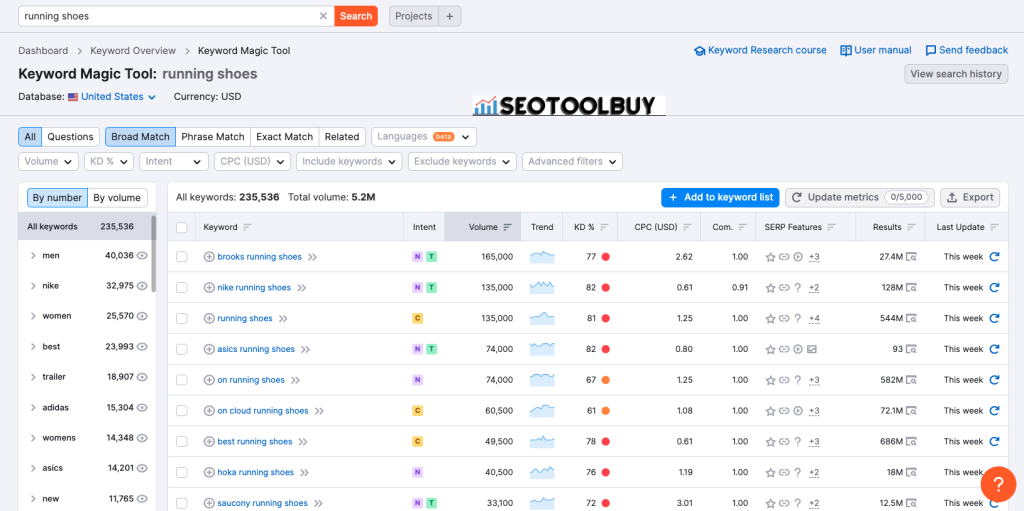
We then switched the search criteria from all keywords to questions.
The top searches revealed some consistent themes:
- How long do running shoes last?
- How do you choose running shoes?
- What are the best running shoes for men or women?
This initial search provides some ideas about where to focus our research. For the sake of this example, let’s explore the question of what running shoes consumers think are the best and why.
Automated Market Tracking
with Kompyte by Semrush
.svg)
Step 2: Develop a Market Research Plan
After gaining some understanding of your research goals, develop a plan to take steps toward answers and new understandings. To start, what primary and secondary sources will you use?
What Primary Sources will You Tap Into?
- Will you interview key individuals?
- Will you hold a focus group?
- Could you survey people about their experiences?
What Secondary Sources will You Tap Into?
- What 3rd party research companies have researched your market?
- Could you access customer reviews?
- Can you look at other companies’ marketing efforts?
To return to our example shoe company, if we want to understand more about what shoes runners like best and why, we could pick 3 methods:
- Review studies conducted by 3rd party market researchers about product quality (manufacturing, features, lifespan, etc.)
- Interview runners about their experiences with various shoes
- Hold focus groups to understand how people think, feel, and talk about their favorite brands
Before beginning the hands on research, a birds-eye-view of the market can help you see who the industry leaders are, and what their strategies and growth prospects look like. Semrush’s .Trends tools can help with this preliminary work.
In the Market Explorer tool, you have the option to examine an entire industry, have the tool compile a list of competitors, or create a custom market with competitors of your choice. For the sake of simplicity, we entered 6 domains belonging to popular running shoe brands– nike.com, adidas.com, saucony.com, hoka.com, asics.com, and brooks.com.
The Market Summary is the first thing you’ll notice in the Overview report. This tool provides an overview of the market including the level of consolidation, the key players and their market share percentage, the market size, and more.
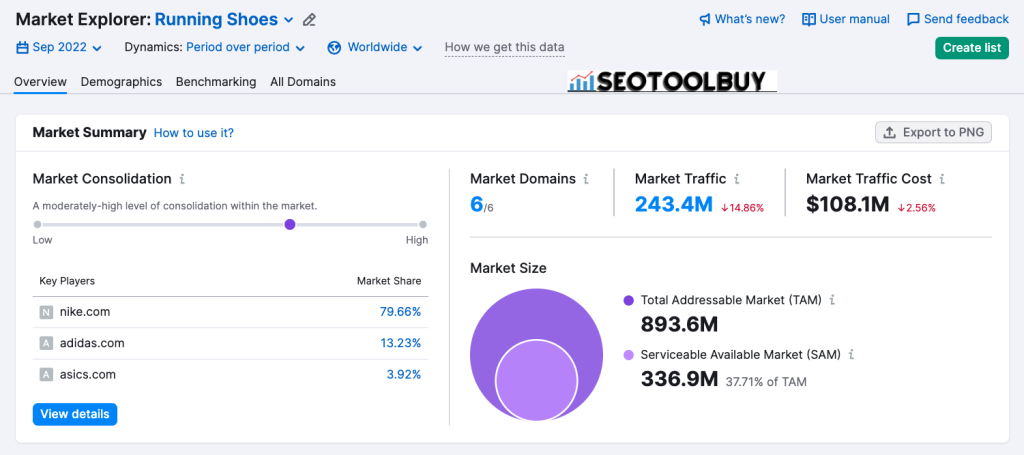
With a quick glance we can see that the market has a moderately-high consolidation level, meaning most of the market share is owned (or “consolidated”) by one large player with a few smaller players owning the remaining share.
We see nike.com is the market leader owning 80% of the market, with adidas.com (13%) and asics.com (4%) in the second and third position. Finally, the Market Size is large with a Total Addressable Market of almost 900M.
Scrolling down, you’ll discover the Growth Quadrant. This tool can help you understand how competitors are growing over time in relation to one another.
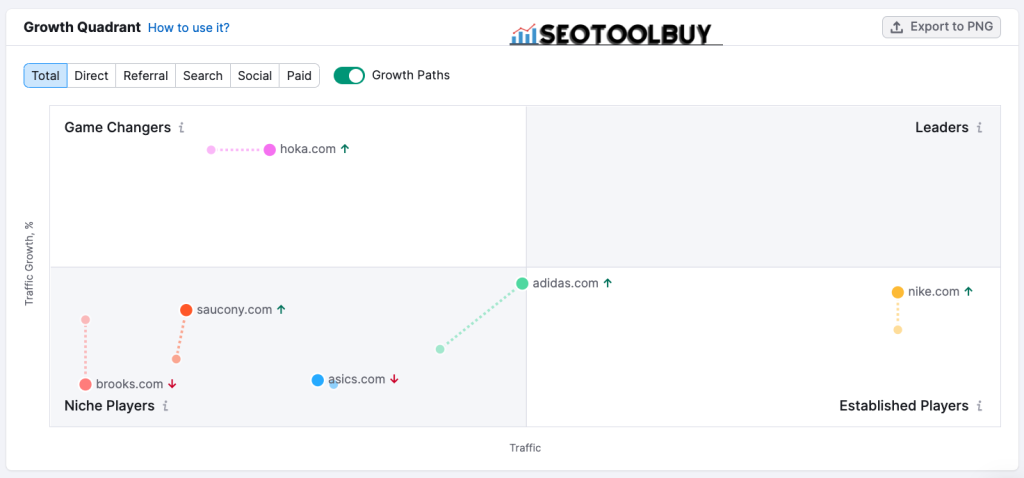
Nike.com holds the lead in terms of traffic, though Adidas saw a larger gain in traffic growth percentage. This growth pushed them from the “Niche Players” quadrant toward the “Established Players” category.
Looking at some of the minor players, saucony.com saw movement toward the “Game Changers” quadrant. In this case, we’d definitely want to look into what they’re doing to drive traffic and ask our research subjects questions about this brand.
Overall, these broad insights can help us think about a number of factors in our research, including what methods we want to use to study them and what kinds of questions we’d like to ask of their audiences. Once we’ve decided which direction to go in, you’ll need to come up with a timeline, delegate responsibilities, and execute.
Step 3: Collect Data for Market Research
How you collect and crunch data will depend on the type of research method you choose.
- For qualitative research, like focus groups or interviews, write out answers and compare notes later. With surveys you might produce reports. Tools like Google Forms or Survey Monkey often offer free reports that organize your data and even include illustrations where applicable.
- For quantitative research, collect raw data using a simple spreadsheet or a more advanced data storage software. Once the data is collected, tools like Google Data Studio or Tableau allow you to organize and depict the data as graphs or charts.
For our footwear company example, we might collect qualitative data through our focus groups and interviews. We could also collect quantitative data using the Semrush .Trends tools.
For example, Traffic Analytics provides traffic numbers for a competitor’s website. Here’s a look at saucony.com’s page insights and top pages.
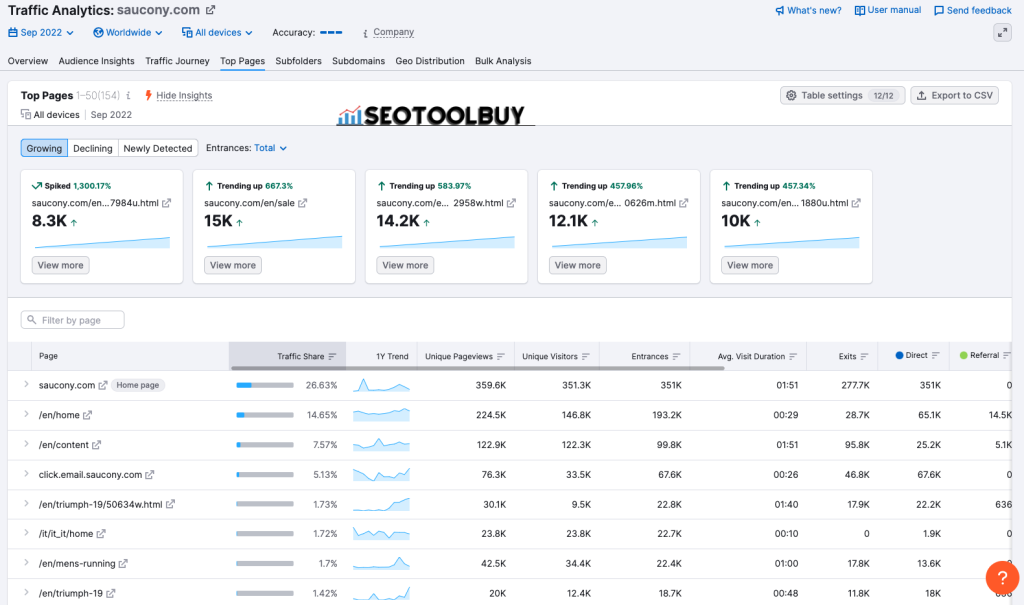
At the top of the report, we can see which pages have shown significant growth in traffic. We could also check the page statistics using the chart below the insights section. In this example, we might discover a page with an upcoming product launch, like Saucony’s Endorphin Pro+ shoes.
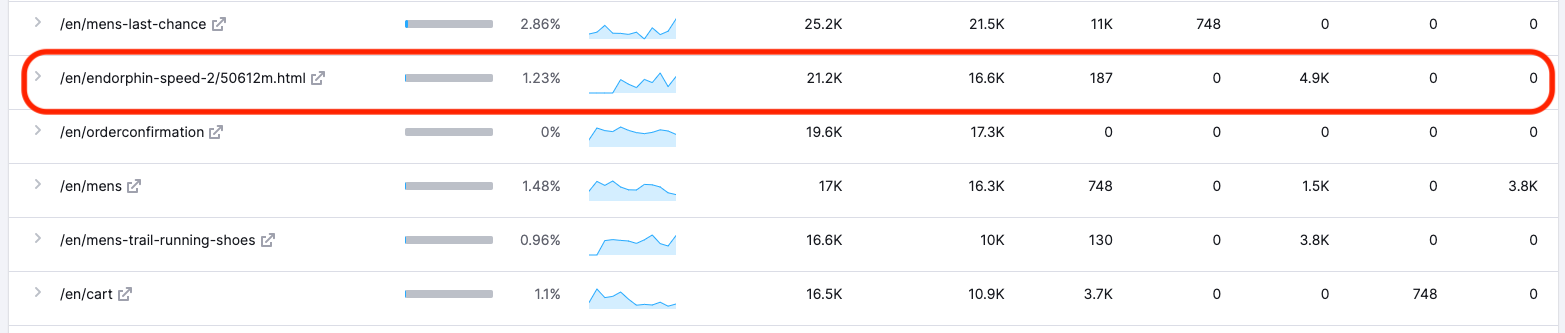
In our focus groups, we could study customer responses to this launch or compare the traffic numbers or sources with new releases coming from competitors.
Step 4: Analyze Data and Generate Insights
Analyzing your data helps you discover answers to your initial research question and turn those answers into strategies. This process begins by organizing the data.
With quantitative data, add everything up and enter it into a central location, like a spreadsheet. Organize ratings, rankings, “yes and no” answers, selections of multiple choice questions, and any other data. Once it’s organized, crunch the numbers to look for averages, ranges, or other important statistics.
For qualitative data, review all of the collected data and sort it into categories. For example: concerns, questions, frustrations, strengths, weaknesses, recommendations. Organizing this data will help clarify themes.
Once your data is organized, review your initial research goals. Here are some guiding questions:
- Does the data illuminate any trends?
- Can I think of any explanations for these trends?
- What’s surprising or interesting about the data?
- Does the collected data help answer my original questions?
- Does it lead to any other interesting questions?
As you notice trends or themes, present them visually. Tools like Miro or Mural can help you brainstorm, discover connections, and invite different people to the table to help interpret the data.
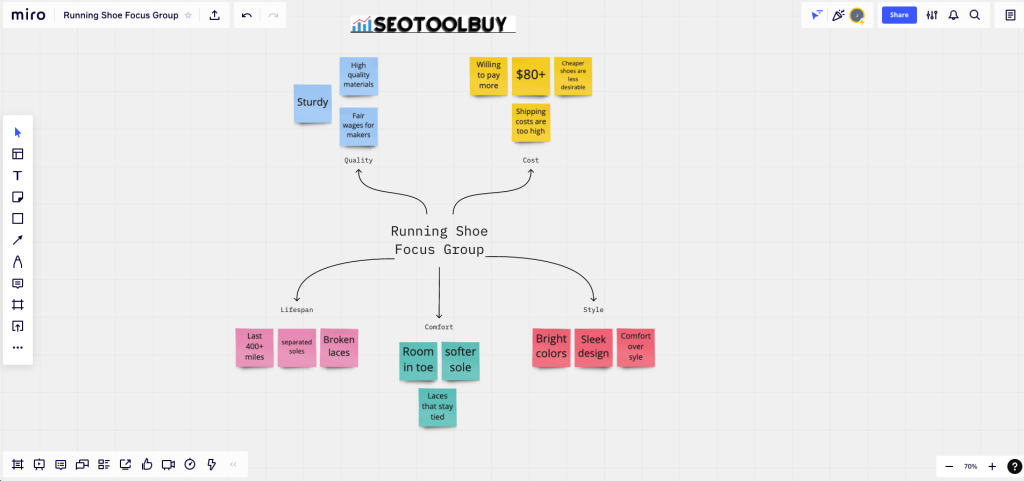
To continue with our footwear company, let’s pretend we discovered these 5 insights based on the data:
- Customers like durable running shoes; their favorite shoes last a long time
- Customers are willing to pay more for quality running shoes
- Customers are less likely to be loyal to one brand; quality matters over brand
- Customers respond best to ads that depict professional runners
- Customers like flashy designs and colors on their running shoes
Highlight data that supports your argument or solves the problems you’re researching.
Don’t worry if you discover negative results or trends. This gives you a chance to change direction or abandon the project altogether, ultimately saving you time and money.
Step 5: Present Your Findings, Adjust Your Plan, and Continue Testing
Now that you’ve done the heavy lifting, it’s time to put the findings to good use. Typically, this involves presenting your research to stakeholders and discussing improvements to your business or marketing plan.
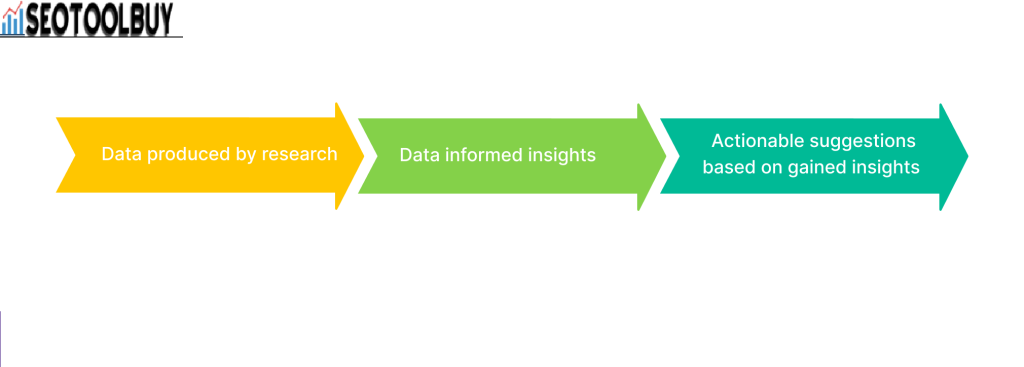
When presenting data, it helps to show:
- How the research produced the data
- How the data led to your insights
- How your insights led to actionable suggestions
Let’s return one more time to our running shoe company. If we wanted to present information about pricing to our stakeholders, we might structure it like this:
- We looked at what shoes avid runners prefer and why. The top shoes tend to be more expensive than less popular shoes. We asked about this in focus groups and interviews.
- Participants told us they’re willing to invest more money into a good pair of shoes. High quality matters more than lower prices. Along with this, runners who pay more expect more durability.
- Based on this data, our business might benefit by using quality materials and manufacturing processes, instead of cutting costs with cheap materials and labor. We could improve our marketing strategy by highlighting the high quality materials, and the care we put into manufacturing each pair.
Once you’ve made adjustments to your business or marketing plan based on the data, continue your research to see if your strategies are successful.
Agile Market Research for Ongoing Assessment
Agile market research is a great way to follow up on the moves you’ve made based on your in-depth market research studies. While it won’t replace in-depth market research, it allows you to test hypotheses, receive feedback, and make swift changes.
Let’s say we conducted a large-scale study on running shoes and launched our new product. Some agile market research could help us determine if the design is as good as possible. We could use surveys, engagement with customer reviews, and a review of recorded customer service calls.
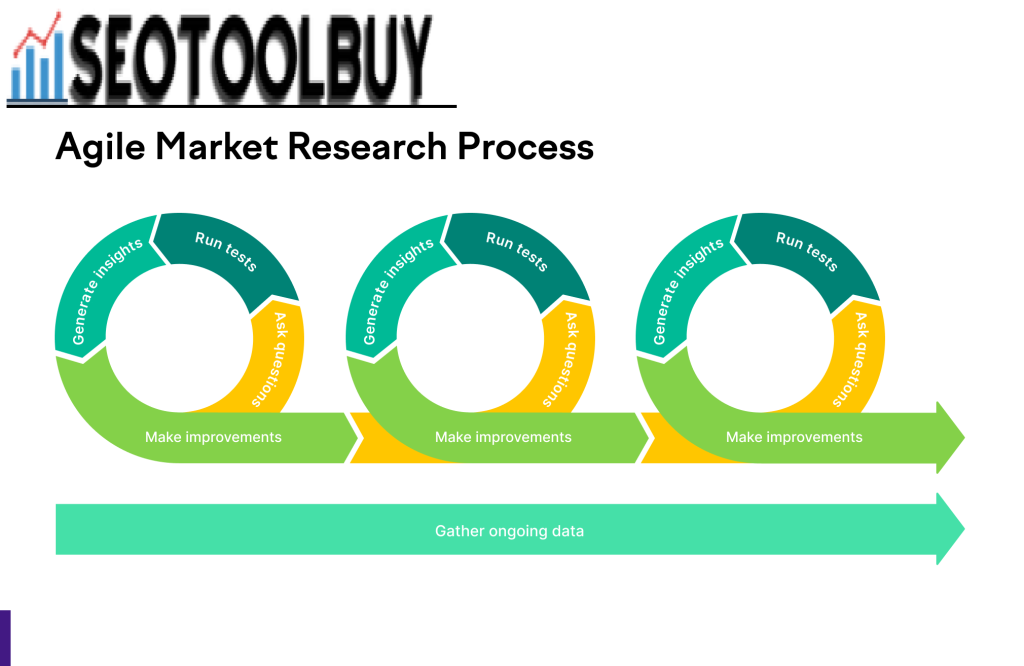
Here’s an example of what the agile market research process might look like:
- Ask questions—Are the new shoes we developed comfortable?
- Run tests—Customer feedback: “The shoes are too tight on my toes.”
- Generate insights—The design of the toe in our shoes needs improvement.
- Make improvements—Adjust the shape of the shoes in the toe. Release new model.
- Ask questions—How do your toes feel in our new shoes?
The agile market research process is iterative, meaning it’s completed over and over again for continuous improvement.
Final Thoughts Before You Start Your Research
Though market research is a big undertaking, it’s necessary for survival in a competitive marketplace. Whether you have the resources to conduct large studies, or bootstrap with agile research tactics, continuous engagement is crucial.
With advances in data technology, the costs and difficulty of conducting market research has improved. Looking toward the future, additional solutions will undoubtedly appear on the market, making research increasingly easier and more affordable. Keep an eye out, stay curious, and good luck out there!
Easily Gather and Share Competitive Data
with Kompyte by Semrush


Забота о домашнем пространстве – это забота о удобстве. Теплоизоляция стен – это не только стильный внешний вид, но и обеспечение сохранения тепла в вашем уединенном уголке. Профессионалы, наши мастера, предлагаем вам переделать ваш дом в прекрасное место обитания.
Наши творческие решения – это не просто утепление, это искусство с каждым слоем. Мы разрабатываем гармонии между красотой и практичностью, чтобы ваше жилище превратилось не только уютным, но и привлекательным.
И самое важное – приемлемые расходы! Мы уверены, что профессиональные услуги не должны быть неподъемными по цене. [url=https://ppu-prof.ru/]Утепление стен снаружи цена за метр[/url] начинается всего от 1250 рублей за квадратный метр.
Применение современных технологий и материалов высокого качества позволяют нам создавать утепление, обеспечивающее долговечность и надежность. Оставьте в прошлом холодные стены и лишние затраты на отопление – наше утепление станет вашим надежной защитой от холода.
Подробнее на [url=https://ppu-prof.ru/]http://ppu-prof.ru/[/url]
Не откладывайте на потом заботу о приятности в вашем доме. Обращайтесь к квалифицированным специалистам, и ваше жилье станет настоящим архитектурным шедевром, которое принесет вам тепло и удовлетворение. Вместе мы создадим жилище, в котором вам будет по-настоящему уютно!
Наша группа искусных специалистов находится в готовности предложить вам современные системы утепления, которые не только обеспечат устойчивую защиту от холодных воздействий, но и преподнесут вашему дому стильный вид.
Мы функционируем с новыми строительными материалами, подтверждая постоянный срок работы и превосходные итоги. Теплоизоляция фронтонов – это не только сбережение на тепле, но и заботливость о природной среде. Энергоспасающие разработки, каковые мы осуществляем, способствуют не только личному, но и поддержанию природных богатств.
Самое главное: [url=https://ppu-prof.ru/]Утепление фасада дома снаружи цена москва[/url] у нас стартует всего от 1250 рублей за м²! Это бюджетное решение, которое переделает ваш дом в реальный приятный корнер с минимальными затратами.
Наши труды – это не исключительно изоляция, это составление поля, в где каждый элемент отражает ваш персональный стиль. Мы примем в расчет все ваши пожелания, чтобы преобразить ваш дом еще больше уютным и привлекательным.
Подробнее на [url=https://ppu-prof.ru/]веб-сайте[/url]
Не откладывайте труды о своем квартире на потом! Обращайтесь к специалистам, и мы сделаем ваш корпус не только тепличным, но и стильнее. Заинтересовались? Подробнее о наших предложениях вы можете узнать на интернет-портале. Добро пожаловать в мир удобства и уровня.
Wow Thanks for this publish i find it hard to unearth extremely good content out there when it comes to this material thank for the blog post site
Wow Thanks for this content i find it hard to come across good quality specifics out there when it comes to this material appreciate for the write-up website
Wow Thanks for this write-up i find it hard to see smart important info out there when it comes to this content thank for the blog post website
nice blog mate.. amazing content.. this one i search for. thank you
Wow Thanks for this write-up i find it hard to find excellent ideas out there when it comes to this subject material thank for the guide website